



Fuel retail is a volume game with thin margins. Operators know their numbers well. They know cost per gallon, throughput per pump, and revenue per site. What most do not know until the end of the month is how much product left the tank without showing up in the register.
Meter drift is that problem. It is mechanical, gradual, and almost impossible to catch through traditional reconciliation. It erodes margin invisibly, month after month, until the audit finally surfaces a variance that is already weeks old. By then, the money is gone.
The path from reactive auditing to real-time loss detection runs through the gap between two systems that have never really talked to each other: the dispenser and the POS.
Why Monthly Reconciliation Leaves Money on the Table
The standard reconciliation workflow pulls three data sources. The ATG (Automatic Tank Gauge) records what left the tank. The POS records what was charged at the pump. And a reconciliation report, typically generated at month’s end, compares the two.
That monthly cadence made sense before real-time data infrastructure existed. It doesn’t make sense now. A fuel dispenser meter experiencing 2% drift on a site pumping 50,000 gallons per month is giving away roughly 1,000 gallons before anyone sees a report. At current wholesale costs, that’s more than 3,500 in unrecorded product loss per month, or [over 42,000 per year on a single high-volume site](https://warrenrogers.com/common-sources-of-fuel-loss-for-retail-operators/). The report arrives. The variance gets logged. The investigation starts after the fact.
The problem is structural, not procedural. Monthly reconciliation is designed to detect what already happened. It is not designed to prevent it from continuing to happen.
The Gap No One Is Monitoring in Real Time
The dispenser and the POS were not designed to communicate directly. The dispenser measures flow: how many gallons physically moved through the meter. The POS records the transaction: how many gallons the customer was charged for. The ATG measures tank inventory at set intervals.
Each system captures a piece of the picture. None of them, on their own, can detect a meter that is over-dispensing by a small but consistent margin. The variance only becomes visible when the three data streams are cross-referenced, and traditional systems do that cross-referencing once a month.
That gap between the dispenser and the POS is where meter drift hides. A meter that drifts gradually shows up as a reconciliation exception, not as a hardware flag. It gets treated as a bookkeeping discrepancy rather than an equipment problem. And because the investigation happens after the reporting cycle closes, the drift continues through the next cycle while the team is still reviewing last month’s numbers.
What the Interscope AI Platform Does With the Fuel Data Stream
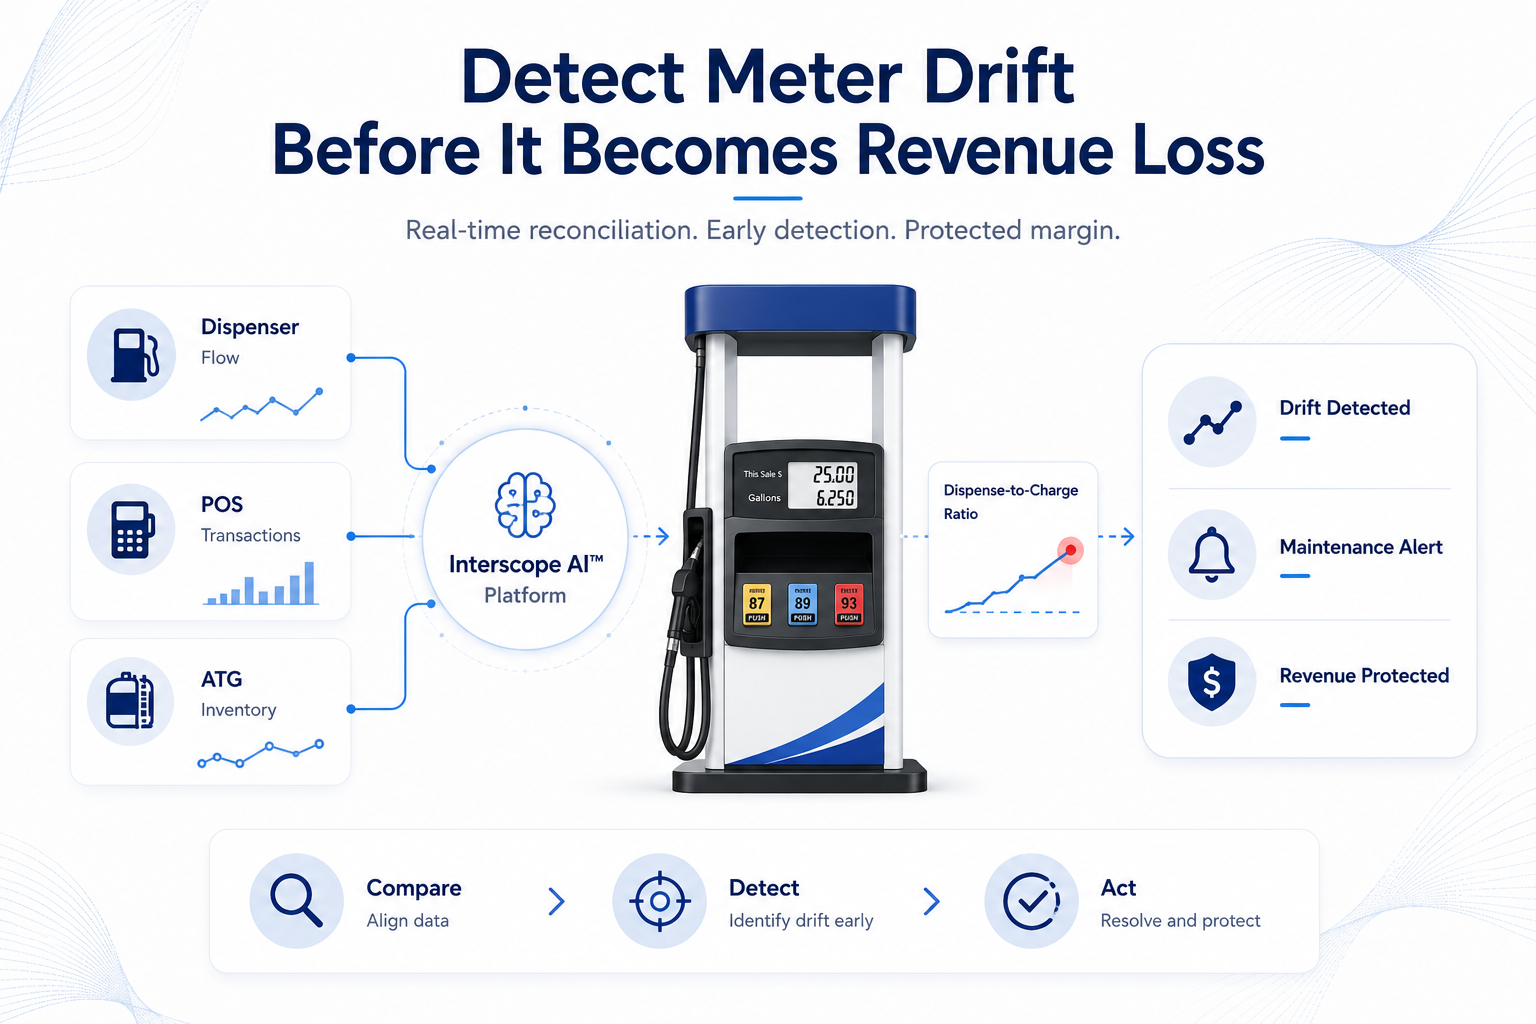
The Interscope AI Platform closes the gap by ingesting all three data streams continuously and cross-referencing them in real time. Those streams are dispenser flow data, POS transaction logs, and ATG inventory levels.
Interscope normalizes inputs from systems that were never designed to talk to each other. It establishes a baseline dispense-to-charge ratio for every pump on every shift, accounting for variables like temperature, product grade, and throughput volume. When a pump’s ratio starts drifting from its established baseline, the platform surfaces the variance immediately. Not at month’s end. At the point in time when the pattern becomes statistically distinguishable from normal variation.
That distinction matters more than it might seem. A single bad reading is noise. A consistent directional drift across multiple transactions on the same pump is a signal. Interscope separates those two things automatically. The team does not have to sort through raw exception reports to find the problem. The problem is already identified and quantified when they look at the dashboard.

Where JERA AI Agents Drive the Response
Detection without action is still just a better report. The JERA AI Agent layer is what turns the signal into a response.
When Interscope flags a variance pattern that crosses the defined threshold, JERA can:
- Route a maintenance alert to the technician queue with the pump ID, the variance magnitude, and the transaction window in which the drift became detectable.
- Flag the site manager with a projected loss rate based on current throughput, so the business impact is visible before the investigation begins.
- Trigger a reconciliation review workflow that pulls the specific transactions in question and compares them against the ATG record for that period.
The investigation happens while the data is still current. The cause gets addressed while the cost is still recoverable. And the audit at month’s end reflects a variance that was already found, documented, and resolved. It does not open a new investigation.
Three Things Live Reconciliation Catches That Monthly Auditing Misses
When real-time cross-referencing is in place, three categories of margin loss become visible before they compound.
The first is gradual meter drift. The kind that moves slowly enough to stay inside the statistical noise of a monthly report but is consistent enough to cost a meaningful amount over a quarter. The continuous baseline comparison catches it early.
The second is shift-specific variance. A pump that shows normal aggregate numbers for the month but shows consistent over-dispense on a specific shift is invisible to monthly reconciliation. Real-time monitoring surfaces that pattern within days.
The third is acute mechanical failure. A meter that begins over-dispensing sharply due to a worn component will show a spike in the dispense-to-charge ratio within hours of the failure onset. Monthly reconciliation would catch that spike too. It would just take weeks longer.
What This Looks Like for Multi-Site Operators
The value of live reconciliation compounds at scale. A single site with one drifting pump is a contained problem. A network of ten sites, each with multiple pumps, operating on monthly reconciliation cycles, is a problem that grows faster than the reporting cadence can track it.
Convenience stores account for approximately 80 percent of the fuel purchased in the United States. For operators running on fuel margins measured in cents per gallon, undetected meter drift across a network is not a rounding error. It is a structural margin leak that compounds month over month until the annual audit surfaces it.
Multi-site operators using the Interscope platform get a unified view across every location. Variance patterns are ranked by magnitude and site. A pump at location three that is drifting at twice the rate of any other asset in the network rises to the top of the exception queue. That happens not because someone ran a cross-site comparison report, but because Interscope is already doing that comparison continuously.
The 90-Day Proof of Value
Moving from monthly auditing to live reconciliation does not require a multi-year platform replacement. The path runs through a focused 90-day engagement.
Phase one is a data audit. We map what the ATG, dispenser flow, and POS systems are capturing, assess data quality, and identify which pumps or sites carry the highest reconciliation variance. Phase two is the proof of value. We deploy Interscope on a defined set of pumps, establish the baselines, and let the platform run against live transaction data. Real variances surface on real equipment within weeks. Phase three is scale. We extend coverage across the full site network and light up the JERA agent workflows on the response protocols the team defines.
The 90 days shows whether the AI layer changes the reconciliation number on real equipment before any enterprise-wide commitment is made.
The Bottom Line
Meter drift is a hardware problem that hides in a software gap. The dispenser over-dispenses. The POS records the charge. The ATG records the inventory draw. None of those systems, operating independently, can flag the discrepancy in real time. The monthly reconciliation catches it eventually. By then, the loss has already accumulated.
Closing that gap requires a unified data layer that reads all three streams continuously and flags variance while there is still time to act. That is what Interscope does. The JERA AI agents handle the routing and the response. And the monthly audit shifts from a discovery exercise to a confirmation of what the platform already found.
For operators running a multi-site fuel network on thin margins, that shift is not an incremental improvement. It is a fundamental change in how margin gets protected. The same AI layer that closes the reconciliation gap also transforms the broader fuel management picture for fleet and retail operations alike.
Frequently Asked Questions (FAQ)
1. What exactly causes meter drift, and why is it so hard to detect?
Meter drift happens when the mechanical components inside a fuel dispenser wear over time, causing the meter to measure slightly more fuel than it actually dispenses. Less commonly, it drifts in the other direction. The drift is gradual and directional, which means it stays inside the noise threshold of monthly reconciliation for weeks or months before it becomes statistically obvious. Real-time cross-referencing against POS and ATG data catches the directional pattern early, before the losses compound.
2. We already have an ATG system. Why isn’t that enough?
ATG systems measure tank inventory accurately. They tell you how much fuel left the tank. They do not tell you whether the amount charged at the pump matched the amount that moved through the meter. Catching meter drift requires comparing the ATG read against the dispenser flow data and the POS transaction record simultaneously. Without that three-way cross-reference running continuously, the ATG gives you the total loss but not the source.
3. What does JERA actually do for fuel reconciliation?
When Interscope flags a variance pattern, JERA routes a maintenance alert with the pump ID and variance magnitude, flags the site manager with a projected loss rate, and triggers a reconciliation review workflow that pulls the specific transactions for review. The action lands in the systems the team already uses. No new dashboards to check, no manual exception reports to run.
4. Do we need to replace our existing POS or ATG infrastructure?
No. Interscope sits on top of the systems already in place. It ingests data from your current ATG, dispenser flow outputs, and POS transaction logs through standard interfaces. The integration does not require replacing equipment or retraining staff on a new platform.
5. How quickly can we expect to see results?
Bridgera’s 90-day proof of value is designed to surface real variance patterns on real equipment within the first four to six weeks. By the end of the engagement, operators typically have a clear picture of which pumps are drifting, what the projected annual loss rate was, and what the corrected baseline looks like after maintenance action.
About Bridgera
Operational Intelligence. Production-Ready AI.
Bridgera partners with operations-heavy enterprises to move AI beyond pilots and into real production systems. Through AI consulting, specialized talent, and scalable platforms like Interscope AI™, Bridgera embeds intelligence directly into the operational workflows that power the business.